F1 live timing is the layer that turns a broadcast into a session you can actually read. The television picture shows the car selected by the director; the timing screen keeps all drivers in view and records position, lap time, gaps, sectors, tyre use, pit activity and official messages. Formula 1’s current service also advertises a live driver map, selected team radio and car-data displays. Used together, those feeds explain why a driver is gaining, whether the gain is sustainable and which strategic decision is about to matter.
The trick is not to stare at the quickest lap. A purple sector can belong to a driver on a low-fuel qualifying run, while a slower car may be producing the most impressive race stint on old tyres. An interval can collapse because of traffic rather than raw pace. A driver can disappear down the order simply because rivals have crossed the line on fresher rubber. Live timing supplies clues; the reader still has to put them in the correct session context.
This guide provides that reading order. Keep it beside this weekend’s F1 schedule, open the official feed before the cars leave the garage, and you will be able to follow the developing contest rather than wait for the commentary to summarize it.
Start With the Leaderboard, Not the Fastest-Lap Headline
The first scan should establish the session state: who is classified where, how many laps each driver has completed, which drivers are on track, and what timing reference the screen is using. In practice and qualifying, the order is usually based on each driver’s best completed lap. During a race, it reflects running order, laps completed and the timing line. That difference sounds elementary, but it prevents the most common mistake—treating a practice table like a race order or a race interval like a pure pace ranking.
Gaps and intervals answer different questions
Gap usually measures a driver against the leader or the session’s fastest benchmark. Interval normally measures the distance to the car immediately ahead. If the leader is ten seconds up the road and three cars are circulating nose to tail, their gaps to the leader may look large while their intervals reveal the real fight. In a pit-stop phase, interval is the useful number: it tells you whether a driver can emerge ahead of a rival. Gap is better for judging the shape of the field and whether the leader is controlling or extending.
Always check the column label or selected display mode. A lapped driver may be shown as “1 LAP” rather than with a conventional time gap, and timing can be frozen or corrected around red flags and classification reviews. The number is a measurement at a timing line, not a continuously perfect GPS distance. Watch two or three consecutive updates before calling a trend.
Sector colors show improvement, not the whole lap
A lap is divided into official sectors, and timing interfaces use color to make comparison fast. The familiar convention is purple for the best sector of anyone in the session, green for that driver’s personal best and yellow for a sector slower than the driver’s best. Yet one purple sector does not guarantee a fastest lap. A driver can gain heavily in Sector 1, catch traffic in Sector 2 and abandon the lap in Sector 3. Likewise, a tidy lap made of three personal-best sectors may beat a visually dramatic lap with one standout split.
Read the splits as a sequence. An improvement concentrated on the straights may point to tow, energy deployment or lower drag; an improvement through a technical final sector may instead reflect tyre preparation and grip. Those are hypotheses, not telemetry-backed conclusions. Confirm them against onboard footage, speed information and repeated runs.
Status markers explain sudden position changes
The small labels beside a driver often matter more than the lap-time column. “PIT,” an out-lap indicator or an inactive status explains why a driver is not improving. Deleted-lap notices can remove a qualifying time after the car has crossed the line. Yellow, red and safety-car states change what a representative lap looks like, while an investigation or penalty can alter the official order after the apparent finish.
Read Practice, Qualifying and the Race Differently
The same 1:20.000 lap can mean three different things depending on the session. In practice, it is evidence from a run plan whose fuel load, engine mode and test objective are not public. In qualifying, it is a competitive result—subject to track limits, flags and whether the driver progresses. In the race, a single lap is only one sample inside a stint, often distorted by traffic, tyre management, harvesting, a pit entry or a safety-car delta.
| Session | First timing question | Most useful pattern | Common trap |
|---|---|---|---|
| Practice | What run is this? | Repeated laps on the same compound | Ranking cars by one headline lap |
| Qualifying | Who is at elimination risk? | Sector progress, traffic and time remaining | Counting an incomplete or deleted lap |
| Race | Where is the next strategic fight? | Intervals over several laps and tyre age | Calling every slow lap degradation |
During practice, group laps into runs. An out-lap, a sequence of representative laps and an in-lap form a useful block; isolated laps do not. A long run that begins quickly and fades may indicate degradation, but it may also include traffic or a changed instruction. Compare drivers on similar compounds and similar lap ages, then look for a repeatable trend. Save the definitive order for the FIA classification, not a snapshot taken while half the field has yet to attempt a soft-tyre run.
In qualifying, the clock and cut line become central. Track evolution means an early safe lap may slide down the order even while the driver sits in the garage. Follow the final sector, finish-line crossing and deletion messages before declaring anyone through. Our F1 qualifying results page is the cleaner place to confirm the completed classification.
In the race, switch from best laps to sequences and intervals. A driver taking three tenths per lap from the car ahead is strategically relevant; setting one fastest lap after a late stop may not be. Note tyre age, traffic and pit phase, then check the finalized latest F1 results after penalties and classification decisions are applied.
Tyre Data Turns Lap Time Into Stint Context
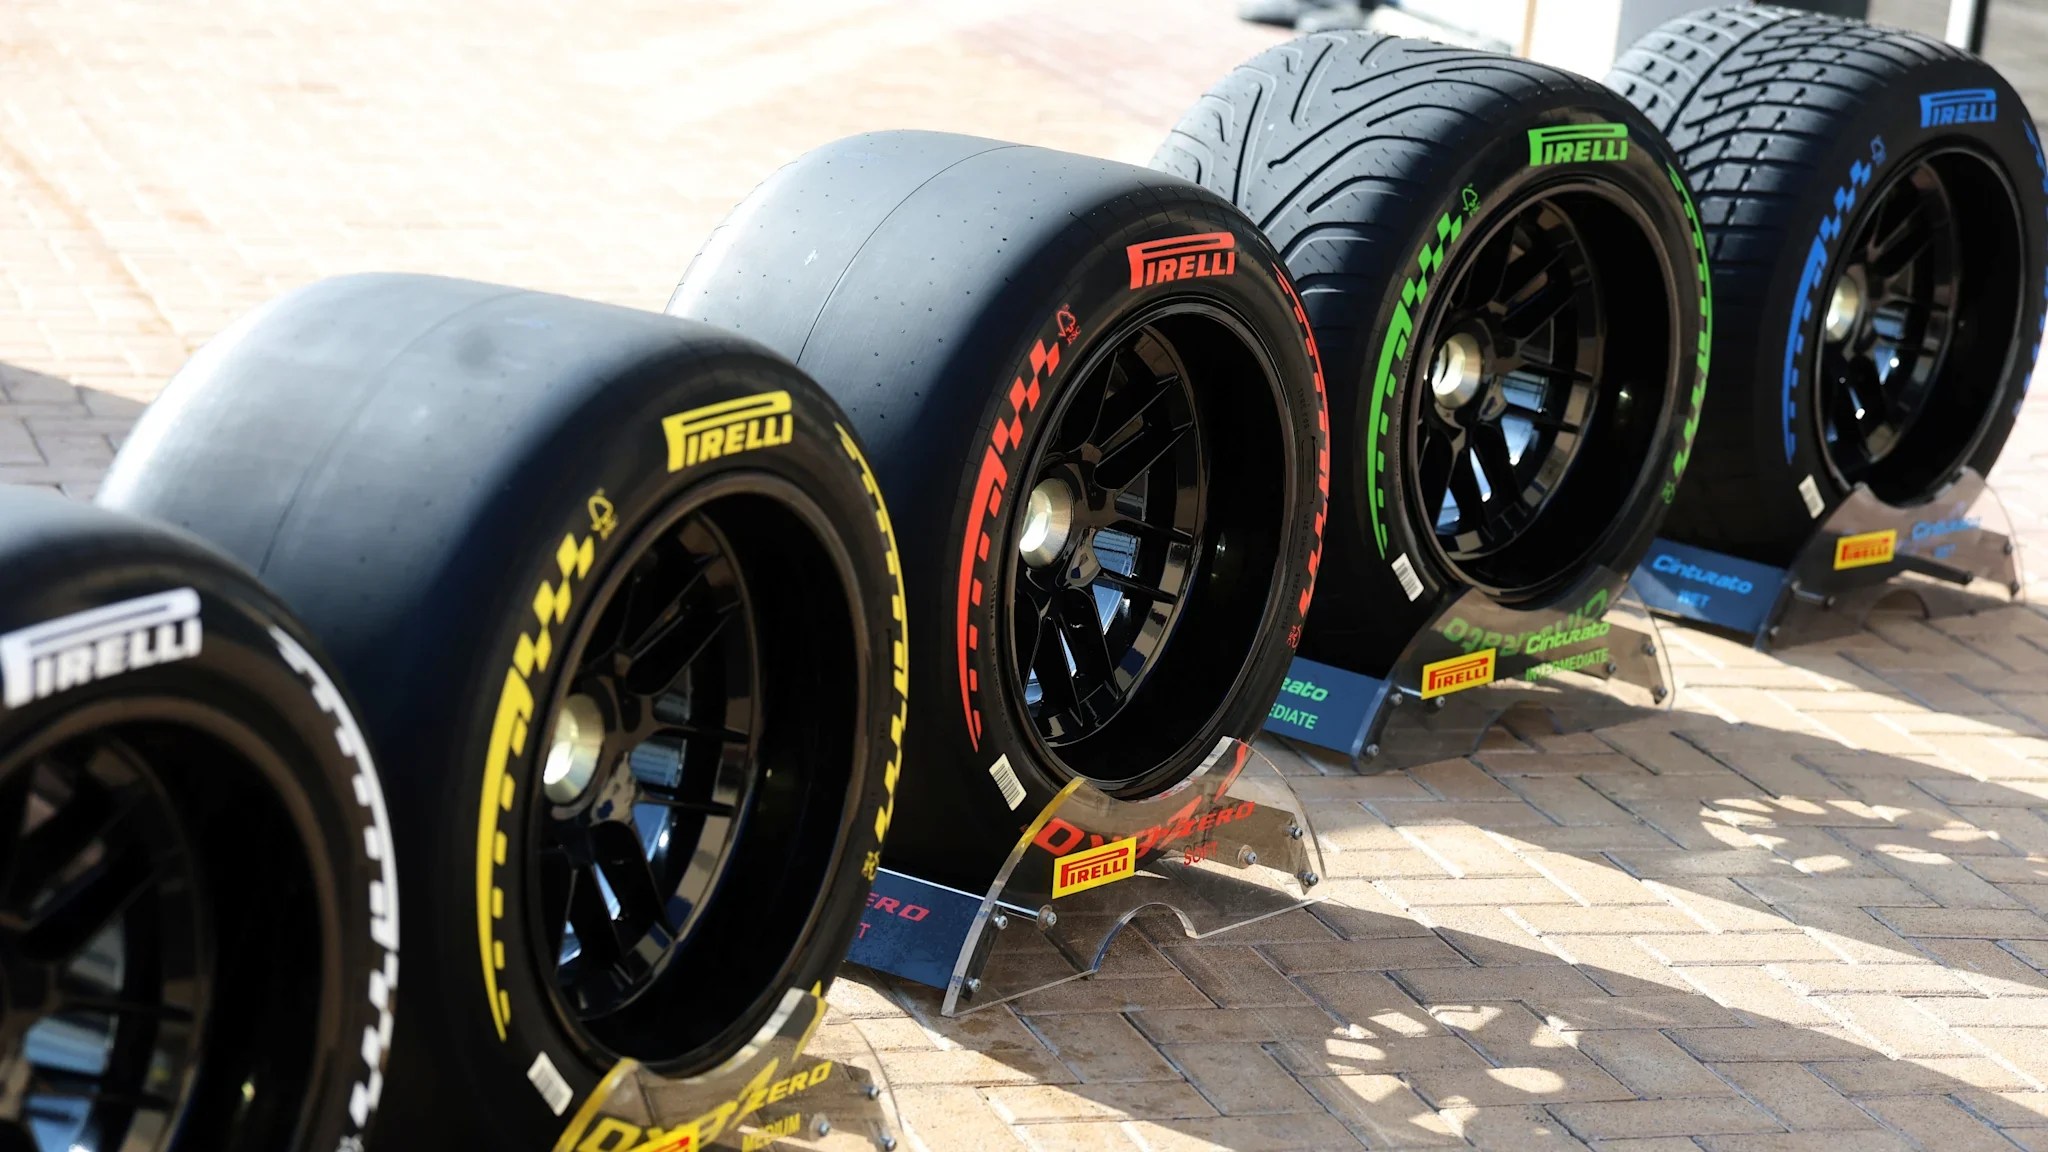
Lap time without tyre context is an incomplete comparison. The timing feed’s compound and usage history let you ask whether two drivers are doing equivalent work. A medium-tyre lap on lap 18 of a stint should not be judged against a soft-tyre lap on lap two as if the cars were in identical conditions. The older run may be more valuable evidence of race pace, while the soft run may matter more for qualifying potential.
Compound and tyre age are only the starting point
A harder compound is generally selected for durability and a softer one for peak grip, but the sidewall color does not settle the comparison. Tyre age counts completed laps, not the stress of each lap. A set used for gentle safety-car running can be nominally old but lightly loaded; a set punished in traffic or overheated behind another car can lose performance quickly. The feed also cannot show every lock-up, flat spot, pressure behavior or thermal cycle in a simple age number.
Look at the shape of five or more representative laps. A gradual drift can suggest degradation, while a sudden loss may coincide with traffic, a mistake or deliberate energy management. Graining, thermal degradation and physical wear are different mechanisms even when all produce slower times. Pirelli’s event previews repeatedly connect strategy to track surface, corner loads, temperature and pit-lane loss; that is why “20-lap medium” is not a transferable performance category from one circuit to another.
Pit-loss and track position shape the strategy window
The useful live-timing calculation is not simply old tyre versus new tyre. It is the interval to rivals, estimated pit-lane loss, likely out-lap warm-up and the traffic waiting at the rejoin point. An undercut works when the chasing driver stops first and gains enough on fresh tyres to beat the rival’s slower in-lap. An overcut reverses that logic: stay out, exploit clean air or strong old-tyre performance, and benefit if the rival’s new set takes time to reach its working range.
Track position can make the theoretically faster choice useless. Pitting into a train costs more than the raw stop because the driver must overtake slower cars. Staying out may protect clean air but expose the car to a rival’s undercut. Under a Virtual Safety Car or Safety Car, the effective time loss changes again. Watch the intervals around the projected rejoin position, then observe whether the driver’s first flying lap on the new set actually delivers the expected gain. That is evidence; the compound label alone is only the opening clue.
Use the Driver Map, Radio and Race Control as One Story
Timing numbers become much clearer when matched with where the cars are, what the team has said and what officials have confirmed. Formula 1’s current timing package lists a live driver map, selected team-radio clips and live leaderboard data. None should be read alone. The map supplies spatial context, radio supplies a partial human explanation, and race control establishes the official status.
The map reveals traffic before the leaderboard does
In qualifying, glance at the map as a driver begins the preparation lap. A cluster in the final sector can force cars to slow, cool their tyres or create an unsafe queue; a car closing rapidly may compromise the flying lap before any sector turns yellow. In practice, the map shows whether a slow lap is genuinely poor or was spent yielding to a faster car. During a race, it makes the rejoin problem visible: a pit stop into clear track and a pit stop into a DRS train have radically different value.
Treat icons as location guidance, not engineering-grade traces. Update latency and display smoothing can make two cars appear closer or farther apart than they are. The official timing-line interval remains the better quantitative reference; the map tells you what might explain its next movement.
Team radio is selected evidence, not a complete transcript
Formula 1 explicitly describes its public offering as the “best clips” of team radio. That selection is valuable but incomplete. A driver reporting that the tyres are gone may be describing one corner, managing expectations, or pushing the team toward a stop. The engineer’s full response may not be played immediately. Do not turn one frustrated sentence into proof of a mechanical failure or strategic dispute.
Test radio against behavior. Does lap pace fall across several clean laps? Does the driver change braking or abandon a run? Does the team bring the car in? When message, timing and action point in the same direction, the interpretation strengthens. When they conflict, keep the uncertainty visible.
Race-control messages outrank speculation
A yellow flag, red flag, deleted lap, DRS change, noted incident, investigation and penalty are not interchangeable. “Noted” means officials are aware; “under investigation” is a process, not guilt; a decision states the outcome. The live message is the fastest reliable update, while the written FIA decision supplies the reasoning and exact sanction when one is issued.
This hierarchy matters at the finish. A five-second penalty may change positions only after gaps are applied, and a post-session decision can alter a classification again. Record what the timing screen shows, but reserve definitive language for the official classification. In close sessions, the most disciplined reader is often the one willing to wait one update longer.
What Public Live Timing Cannot Tell You
The public feed is rich, but it is not the team’s complete telemetry system. It does not hand you the full setup sheet, exact fuel load, all tyre temperatures and pressures, aerodynamic balance, component health, private strategy simulations or every radio exchange. Even when a product labels a view “telemetry,” it presents a selected fan-facing data set, not every channel engineers analyze on the pit wall.
That boundary changes how conclusions should be written. A car losing time on the straights is consistent with higher drag, reduced deployment, lift-and-coast, traffic or a technical issue; the timing screen alone cannot choose between them. A long-run fade may suggest tyre degradation, but fuel effect, traffic, battery management and driver instructions remain alternatives. A strong final sector does not prove a particular wing level or suspension setting.
Defensible from the feed
- The interval changed across specified laps.
- A driver used the displayed compound for the listed stint age.
- A sector was a personal or session best.
- Race control announced a stated status.
Needs corroboration
- The exact cause of lost performance.
- How much tyre life remains.
- A team’s intended pit lap or fallback plan.
- Whether a driver or team made an error.
Good live analysis therefore separates observation from explanation. State the visible change first, list the strongest contextual clues, then attach an appropriate confidence level. Onboard video, official documents, post-session interviews and repeated lap patterns can strengthen a reading. If they do not, uncertainty is not a weakness; it is the accurate description of the evidence.
Timing can also lag, correct itself or display an incomplete lap before official review. Treat the live screen as the best developing record and the final FIA classification as the settled result. That habit prevents an exciting real-time interpretation from hardening into a false technical claim.
A Practical Two-Screen Workflow for Every Session
A useful setup does not require a replica pit wall. Put the broadcast on the larger screen and timing on a phone, tablet or laptop. Formula 1 currently supports timing and viewing features across common web and mobile devices, although products and availability differ by territory. The goal is to keep the field-wide evidence visible while the broadcast supplies onboard footage, commentary and replays.
Before the session: open the right schedule and timing views
Confirm the start time on the F1 schedule and use the F1 TV schedule to identify the broadcaster in your market. Sign in and load the official timing page before pit exit; authentication or app updates are frustrating once qualifying has started. Choose the core leaderboard, then make the tyre history and driver map one tap away. More columns are not automatically better on a small screen.
Set your question for the session. In FP2 it might be long-run consistency. In qualifying it is the cut line, traffic and remaining attempts. In the race it is the next pass, undercut or tyre offset. A defined question keeps every purple sector from becoming a distraction.
During the session: follow changes in a fixed order
- Establish state: session clock or lap, flags, cars on track and current order.
- Find the contest: switch between leader gaps and car-to-car intervals.
- Check comparability: compound, stint age, lap type and traffic.
- Read the trend: use several sectors or laps, never one isolated update.
- Add context: map, selected radio and race-control messages.
- Confirm: wait for the completed lap, official message or final classification.
During a pit cycle, write down the interval before the stop and identify the likely rejoin group. In qualifying, note who has crossed the line and who is still completing a lap when the clock reaches zero. At the finish, distinguish provisional running order from the result after sanctions. Then consult the championship standings only after the classification is settled.
With repetition, this scan becomes automatic. Live timing will not make every strategic choice obvious, but it will show the evidence that matters: the interval moving, the tyre offset growing, the traffic appearing and the official status changing. That is enough to follow the race on its own terms—and to know when the available data still does not justify a conclusion.
Loading comments…